 Mgt 3325 -
Home Spring 2010
Email
to Dr. Lyons
PatLyons Home
Mgt 3325 -
Home Spring 2010
Email
to Dr. Lyons
PatLyons Home
[ Calendar12:20 |
1:25
| Class Participation AI | App of OM |
Table of Contents | Search ]
[ Ch 1 | 2 |
3 | 4 | 5
| 6 | 6S |
7 | 8 | 9 | 10 | 11
| 12 | 13 | 14
| 15 |
16 | 17 | | HW1 | 2 | 3
| 4 | | Career1| 2
| 3 | 4
]
[
SJU
|
TCB |
CareerCenter |
StudentInfo |
CareerLinks |
Internships ] [NYC Teaching
Fellows] [
SJU Closing ] [H1N1SelfAssessment]
Ch 9 - Layout Strategy
- Introduction
(p348)
- Layout strategy specifies the location of departments, processes, machines, desks
and support services for effective and efficient production.
- Objectives
- Minimize cost of materials handling
- Minimize cost of information flows (face-to-face communications)
- Minimize safety risks
- Provide flexibility for new products
- Process-Oriented Layout
(p356)
- Used for low-volume, high-variety production (intermittent process). Each product
can have a different sequence of operations.
- Examples: general practice law office, machine shop, hospital. See Fig 9.3, p356.
At Arnold Palmer Hospital, no patient room is more than 14 feet from a
nursing station (Fig 9.23, p383).
- Primary concern: manage varied flow of material
and/or people for each product.
See Table 9.1, p349, for primary concern for each layout.
- *Process-oriented Layout Technique
- Input data
Number of loads moved between Departments (Fig
9.4, p357)
Cost to move a load between
Areas
(Fig 9.5, p358)
- Objective - assign departments to
areas so as to minimize material handling cost
= ĺ (load) * (cost)
- Evaluation of a typical layout (Figure 9.8, p359)
Area A
Dept 2 |
Area B
Dept 1 |
Area C
Dept 3 |
Area D
Dept 4 |
Area E
Dept 5 |
Area F
Dept 6 |
| Load |
50 |
100 |
20 |
30 |
50 |
10 |
20 |
100 |
50 |
Source:
Load Matrix, Fig 9.4 |
| From dept to dept |
1-2 |
1-3 |
1-6 |
2-3 |
2-4 |
2-5 |
3-4 |
3-6 |
4-5 |
| From area to
area |
B-A |
B-C |
B-F |
A-C |
A-D |
A-E |
C-D |
C-F |
D-E |
Source:
Layout, Fig 9.8 |
| Cost |
1 |
1 |
1 |
2 |
1 |
1 |
2 |
1 |
1 |
| Load * Cost |
50 |
100 |
20 |
60 |
50 |
10 |
40 |
100 |
50 |
|
ĺ
(load) * (cost) =
$480
Do Assigned HW
- Office Layout
(p350)
- Used to facilitate group work.
- Examples: medical office, accounting firm.
- Primary concern: minimizing cost of
(face-to-face) information flows.
- Special case of Process-Oriented Layout.
- *Layouts analyzed with the above Process-oriented Layout
Technique (II.D)
- Retail Layout
(p351)
- Used to display products to customer.
- Examples: department store, supermarket.
- Primary concern: exposing customer to products.
- Special case of Process-Oriented Layout.
- Typical layout rules (p351).
- Locate high-draw items around the periphery of the store.
- Use end aisle locations because they have high exposure.
- *Allocate square feet of floor and/or shelf space to each
product so as to maximize profit consistent
with full line stocking requirements.
- Storage Layout
(p353)
- Used to store products for future use.
- Examples: distributor, warehouse
- Primary concern: minimizing material handling and warehouse space costs.
- Special case of Process-Oriented Layout.
- *Layouts analyzed with the above Process-oriented Layout
Technique (II.D)
- Product-Oriented Layout
(p364)
- Used for high-volume, low-variety production (continuous or repetitive process).
Each product has same sequence of operations.
- Examples: TV assembly line, meat packer,
insurance claims.
- Primary concern: minimizing the number of
workstations (this usually results in minimizing the imbalance in idle time,
but not necessarily). Please note that this differs slightly from Heizer,
p365.
- *Product-oriented Layout Technique - Assembly Line Balancing
- Input data
Tasks
Task times - times to perform each task
Precedence
relationships - tasks which must be completed before another
task can start
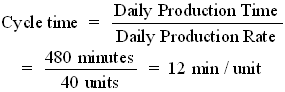
Cycle time - length of time the product is at each work station
- Objective - assign tasks to work stations so as to minimize the number of work
stations.
- Example - electrostatic wing component - p367
| Task |
Time - t i
(minutes) |
Precedence
Relationship |
A
B
C
D
E
F
G
H
I |
10
11
5
4
12
3
7
11
3 |
-
A
B
B
A
C,D
F
E
G,H |
| Total time |
66 |
|
- Draw Precedence Diagram - page 367
- Heuristic Procedure
- Determine Available List - tasks whose
precedence relationships are satisfied
- Select from the Available List the task with the largest
possible time such that for each work station:
sum of task times Ł cycle time
- Update the Available List
- Go to step b.
| Available List |
Selected Task |
Time |
Station |
| A |
A |
10 |
1 |
| B, E |
E |
12 |
2 |
| B, H |
B |
11 |
3 |
| C, D, H |
H |
11 |
4 |
C, D
D
F |
C
D
F |
5
4
3 |
5
5
5 |
G
I |
G
I |
7
3 |
6
6 |
- Optimality test
m - minimum number of work stations
m = S ti / cycle time
rounded up (even if less than 0.5)
m = 66/12 = 5.5 rounded up to 6The above heuristic
solution with 6 work stations is optimal because it is not possible to have a solution
with fewer than m work stations.
Note: if S ti / cycle time
= 5.2, then m = 6.
Do Assigned HW
- Fixed-Position Layout
(p348)
- Used for large, bulky products.
- Examples: ships, buildings and roads.
- Primary concern: moving material to the limited storage areas around the
site (Table 9.1, p349).
- Fixed-position layout uses project management techniques (Ch 3).
- Discussion Item (be prepared to discuss during class):
- Identify a service that you will produce or manage within the
next 5 years.
- Explain which of the above layouts you would use to produce
that service.
(This page was
last edited on
January 15, 2010
.)