 Mgt
509
Home
Fall 2006
Email
to Dr. Lyons PatLyons
Home
[
Calendar | Photo | Class
Participation AI |
Application of Ops Mgt | Table of Contents |
Search ]
[
Chapter
1 | 2 | 3 |
4 | 5 | 6 | 7
| 8 | 9
| 10 | 12
| 13 |
14 | 15 | 16 | 17
| | HW1 | 2
]
[
SJU
|
TCB |
CareerCenter |
QueensEvents |
COACH |
CareerLinks |
MBAServices |
Internships ] [
ProjectLiberty ]
Ch 12 - Inventory Management
- Introduction
(p529)
- Def - Inventory - any resource held to meet internal or external customer demand.
- Objectives - minimize total of:
- Item cost
- Order/setup cost
- Holding cost
- *Stockout cost
- Types of inventory (p530)
- Raw materials
- Purchased parts
- Work-in-process (partially completed products)
- Items being transported
- Tools, and equipment
- Finished goods.
- Functions of inventory (p530)
- Decoupling - when two processes cannot be synchronized, inventory can smooth
fluctuations. Example, firm with high seasonal demand, produces some products in
off-season.
- Hedge against inflation
- Quantity discounts
- Types of Demand (p531)
- Independent demand - typical finished product - demand from many small
external independent
customers. (Ch 12)
- Dependent demand - typical component of a finished product -demand for lawn mower wheels
is dependent on demand for lawn mowers. (Ch 14 - Resource Planning)
- Economic Order Quantity (p537)
- Def - EOQ - the order quantity which minimizes total ordering and holding costs.
- Assumptions
- Uniform demand
- Replenishment of Q units arrives as last unit is used. These assumptions imply (see Fig
12.2) Avg inventory level = Q/2
- Costs
- Annual ordering cost - preparing order, receiving shipment, placing in inventory.
= Co (D / Q)
Co - ordering cost for each order
D - annual demand
Q - order quantity
- Annual holding cost - storage, taxes, investment, insurance, obsolescence
= Cc (Q / 2)
Cc - holding (carrying) cost per unit per year
Q/2 - average inventory level
- Fact: EOQ occurs when ordering cost = holding cost.


Implies

- *EOQ

- See Example 12.2 - p539
Do assigned HW
- Problem 12-1.
- Reorder Point with Variable Demand (p548)
- Definitions
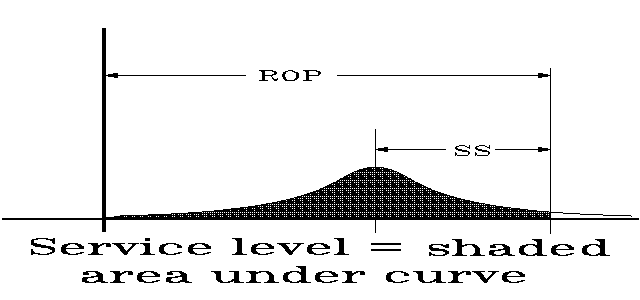
- *Safety stock - extra stock carried to reduce the probability of stockout due to:
· unexpectedly high demand during lead time and/or
· unexpectedly long lead time.
- DL - random variable denoting demand during lead time
- *ROP - reorder point - inventory level (point), at which order is placed
ROP = mean(DL) + safety stock
- *Service level - probability of supplying stock during lead time
service level = Prob( DL £ ROP )

- Example 12.6 -
paint store - p549. Determine safety stock and reorder point, if the desired service level is 95%.
Daily demand is normally distributed with a mean, µd, of 30 and a standard deviation, sd,
of 5. Lead time, L, is 10 days.
- Mean(DL) = µ = µd L = 30 *
10 = 300
Standard deviation(DL) = s = sd
sqrt(L) = 5 * sqrt(10) = 15.81
- Let SS denote safety stock and Z = ( DL - µ ) /
s.
Then, service level = Prob( DL £ ROP ) = Prob( Z £ SS/s )
- From Appendix A, p787, Z1 = 1.65 satisfies Prob(Z £
Z1) = 0.95
- Therefore, safety stock = Z1 s = 1.65 (15.18) = 26.1
gallons
- ROP = mean(DL) + safety stock = 300 + 26.1 =
326.1 gallons
Do assigned HW - Problem
12-33.
- Independent-Demand Inventory Systems
- *Fixed-order-quantity System (Continuous Inventory System, p533)
- Procedure
Establish reorder point, smin,
and order quantity, Q.
Review inventory status with each transaction
If inventory level, I
£ smin
then order Q.
- Advantage
Least safety stock
- Disadvantages
Requires perpetual record keeping
Numerous independent orders
- *Fixed-time-period System (Periodic Inventory System, p534)
- Procedure
Establish max inventory level, Smax
Review inventory status at intervals of T
Order Smax
- I on each occasion.
- Advantage
Consolidation of individual item orders
- Disadvantages
Larger safety stock
Possible small individual order size
- *Min-max system (discussed on bottom
of p550)
- Procedure
Review inventory status at intervals of T
If I
£ smin
then order
Smax - I.
- Advantage
Less frequent orders than Fixed-time-period System
- Disadvantage
Largest safety stock.
- *ABC Analysis
- Procedure - p535
- List inventory items by decreasing value (annual dollar usage, investment, profit, . .
.)
- Group items into classes (more specific than on page
535)
- Class A contains items in top 70% of value -
Typically Class A contains 10-20% of inventory items
- Class B contains items in middle 20% of value -
Typically Class B contains 20-35% of inventory items
- Class C contains items in bottom 10% of value.
- See Example 12.1 - spare parts inventory - p536
- Worksheet for Client ABC Analysis -
click here to download my worksheet,
ABCAnalysis.xls.
- Typical use
| Establish: |
Possible Inventory System: |
| Tight control on A items |
Fixed-order-quantity |
| Moderate control on B items |
Fixed-time-period (computerized) |
| Loose control on C items |
Fixed-time-period (manual) |
(This page
was last edited on
August 16, 2006
.)
![]() Mgt
509
Home
Fall 2006
Email
to Dr. Lyons PatLyons
Home
Mgt
509
Home
Fall 2006
Email
to Dr. Lyons PatLyons
Home ![]()


